PORTFOLIO
Columbia University – Zuckerman Institute
Art in the Education Lab, Spring 2025
Welcome! Below please find 5 portfolio projects that include 5 Images with a brief description for each project (under 200 words) representing the type of work I am proposing for the Art in the Education Lab at the Zuckerman Institute at Columbia University. Thanks so much for your time and consideration.
TABLE OF CONTENTS:
PROJECT 1: “Eclipse Embrace” — Nebula Visualization for Film (Sanchez 2winz)
PROJECT 2: “How to Communicate Effectively with Anyone, Anywhere” — Illustrated Book in Augmented Reality (Career Press)
PROJECT 3: “Hope Rise” — Audio-driven Visualization of Music (Sanchez 2winz)
PROJECT 4: “Data Graph” – Data-driven Visualization (Application: Blender)
PROJECT 5: “3D Surface Plot” — Data-driven Visualization (Application: Grapher)
PROJECT 1:
“Eclipse Embrace”
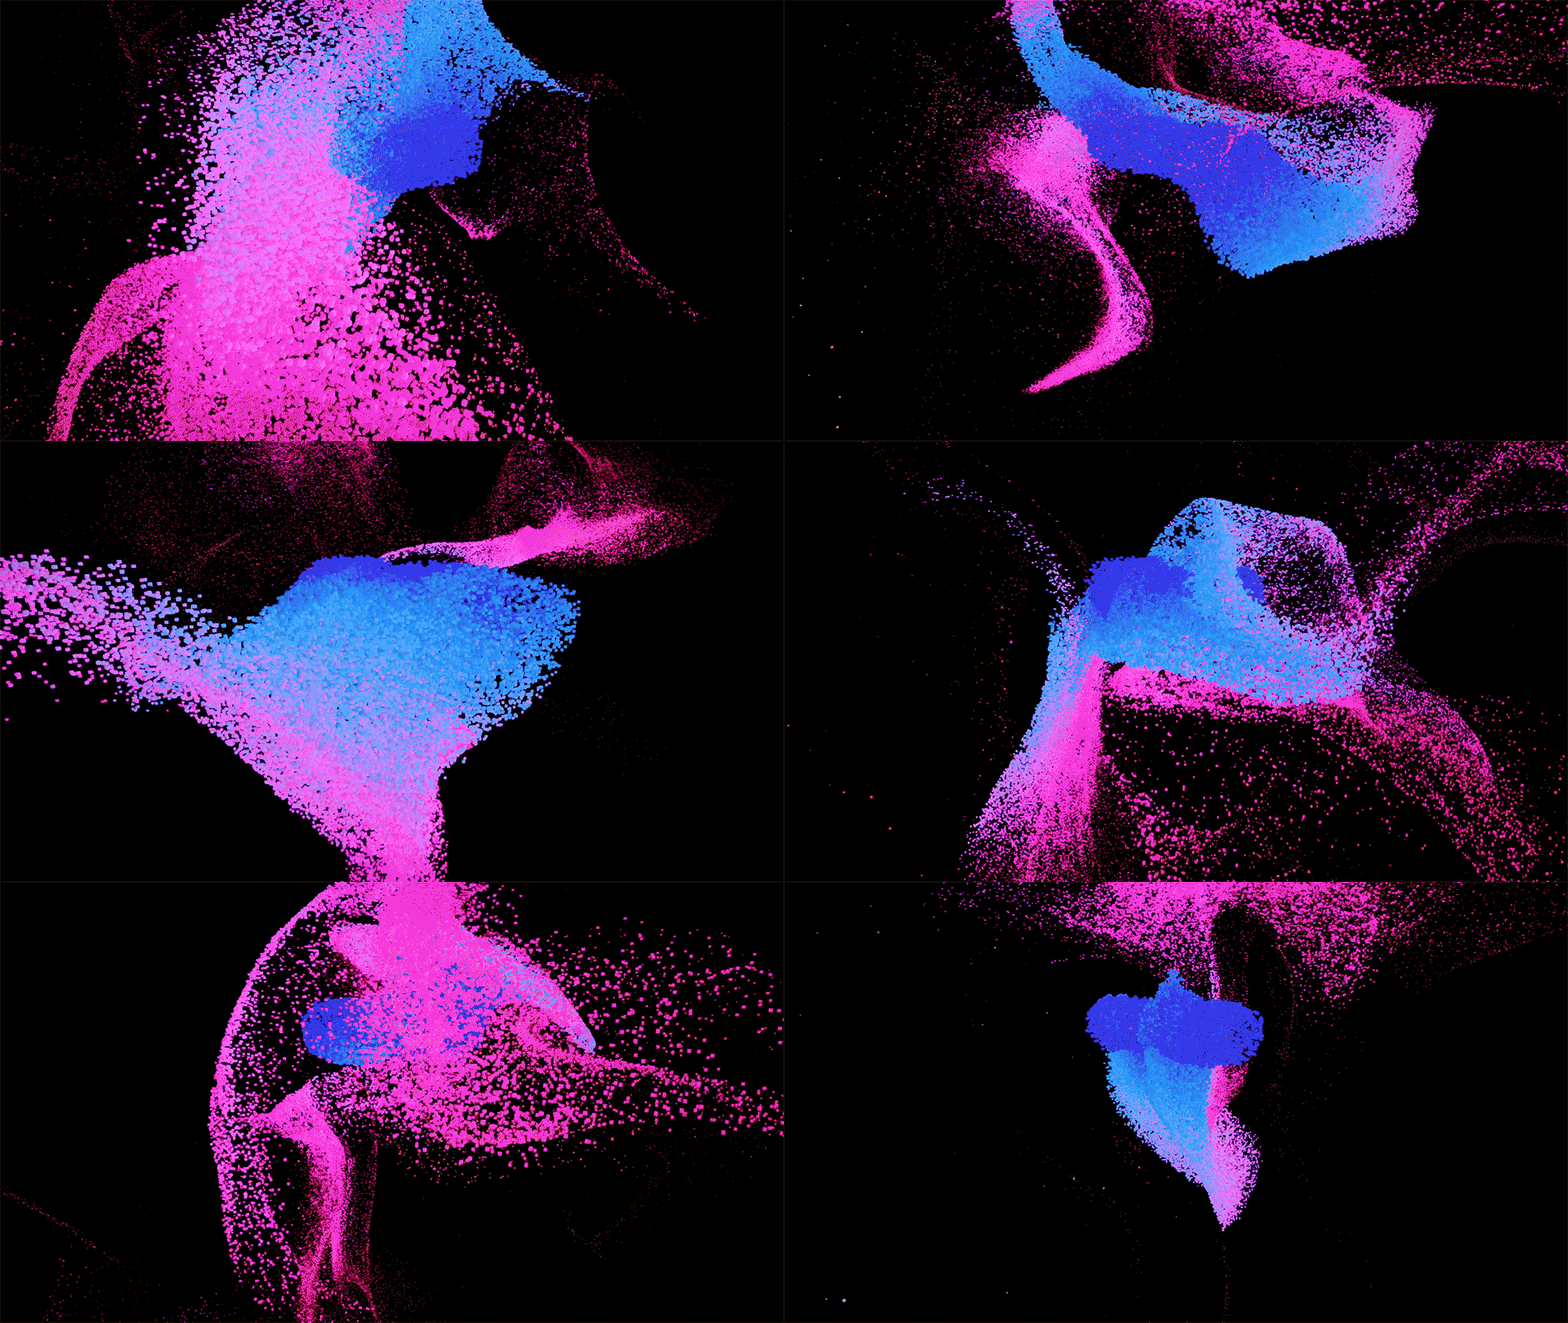
Nebula Visualization for Film
Visualization For Film — (Sanchez 2winz)
“Eclipse Embrace” is a short film, directed by Raul Sánchez and I. The film score is composed by Raúl Sánchez and I (Sanchez 2winz). The image above is an excerpt from the film – a camera fly-through visualization.
(Image: GIF Format)
PROJECT 2:
“How to Communicate Effectively with Anyone, Anywhere”
Illustrated Book in Augmented Reality (AR)
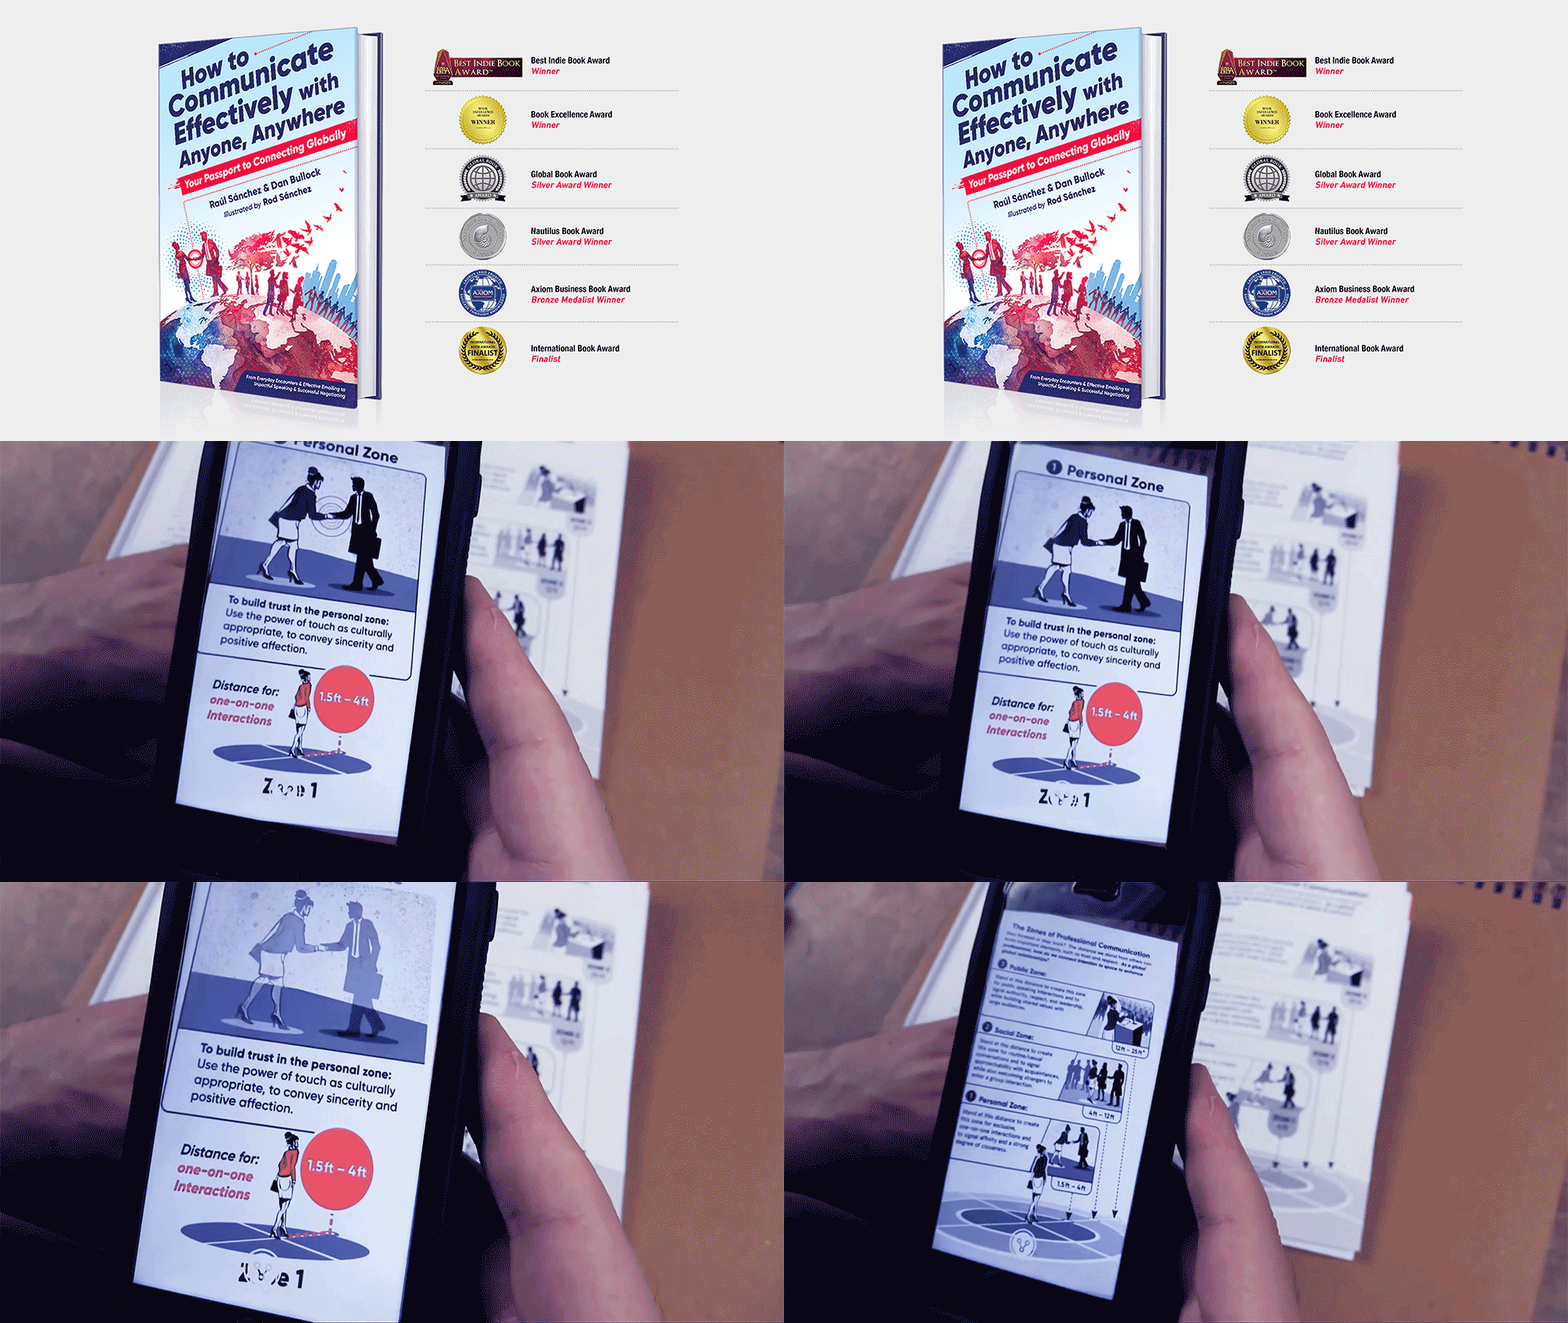
Augmented Reality (AR) Book — “How to Communicate Effectively with Anyone, Anywhere”
I am the Illustrator of the award-winning intercultural communication book, How to Communicate Effectively with Anyone, Anywhere (Career Press), co-authored by NYU professors Raúl Sánchez and Dan Bullock. I led the design of a first of it’s kind augmented reality (AR) learning component of the book in collaboration with the authors where readers use their smartphone to interact with the book’s illustrations on such topics as, how to activate a reader’s schemata and identifying patterns of communication through interactive illustrations, 2D and 3D animation, data visualizations, infographics, animated text, motion graphics, and sound.
How to Communicate Effectively with Anyone, Anywhere has received the following 6 awards:
• Best Indie Book Award (BIBA) – Winner
• Book Excellence Award – Winner
• Global Book Award – Silver Award
• Nautilus Book Award – Silver Award
• Axiom Business Book Award – Bronze Medalist
• International Book Award – Finalist
(Image: GIF Format)
PROJECT 3:
“Hope Rise”
Audio-driven Visualization of Music
Audio-driven Visualization — (Sanchez 2winz)
“Hope Rise” is a track single composed by Raúl Sánchez and I (Sanchez 2winz). The twin brothers have also composed a film score of the short film they directed, “Winged Painter” earning nominations for: Best Music Video and Best Artwork in the (Florida National News). “Winged Painter” was part of a media campaign where we (Sanchez 2winz) successfully raised over $1,000 for RAINN charity. “Winged Painter” was a tribute dedicated to Tori Amos and RAINN (Rape, Abuse & Incest National Network), the largest national anti-sexual violence non-profit organization, named one of "America's 100 Best Charities" by Worth magazine.
(Image: GIF Format)
PROJECT 4:
“Data Graph”
Data-driven Visualization (Application: Blender)
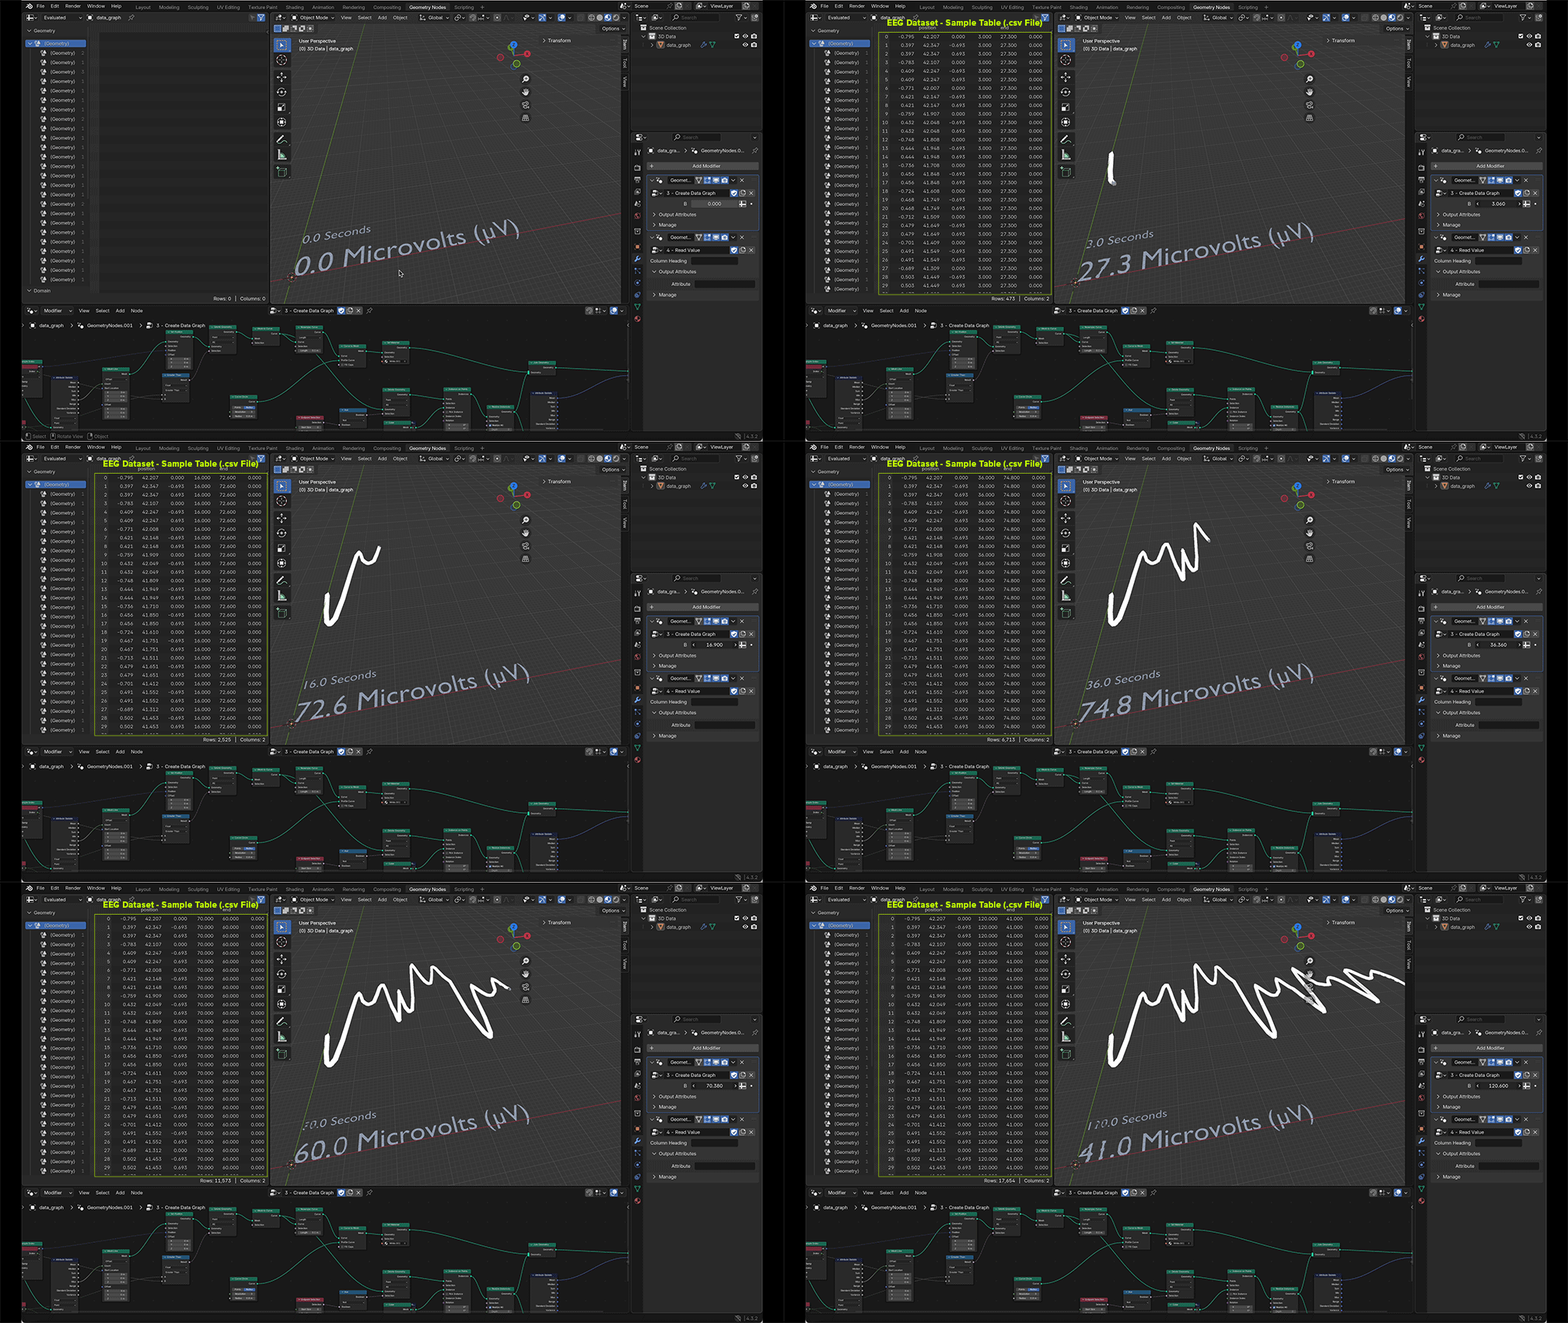
Data-Driven Visualization — (Application: Blender)
This data visualization test explores importing a sample dataset (.csv) file into the 3D application Blender to drive the graph visualization. This example displays the graph being driven by the data table highlighted in green and labeled, “EEG Dataset - Sample Table (.csv File)” within the image. The table’s (x) and (y) values are mapped to the behavior of the graph moving along the x-axis:
• X-axis = Time (seconds),
• Y-axis = Microvolts (µV).
(Image: GIF Format)
PROJECT 5:
“3D Surface Plot”
Data-driven Visualization (Application: Grapher)
Data-Driven Visualization — (Application: Grapher)
This visualization explores utilizing the application Grapher to create a 3D surface plot. The image is a rendering of the surface plot as a 3D wireframe contour mesh. I utilized a gradient of color to reflect frequency changes in the y-axis values of the dataset. For example, if utilizing an EEG dataset and the y-axis = microvolts (µV) the color range could indicate calmness (blue, green) and energetic colors (red, yellow). The color red would highlight the higher microvolt (µV) values in the EEG dataset.


